Pablo Tamarit
- Work:
- Web
- Java, Groovy, Clojure
- GWT
- Freetime:
- JavaScript
- Visual results
Roadmap
- Data visualization
- Data visualization for the web
- Data visualization for the web with D3.js
Data visualization
Data
- More and more data produced
- More and more open data


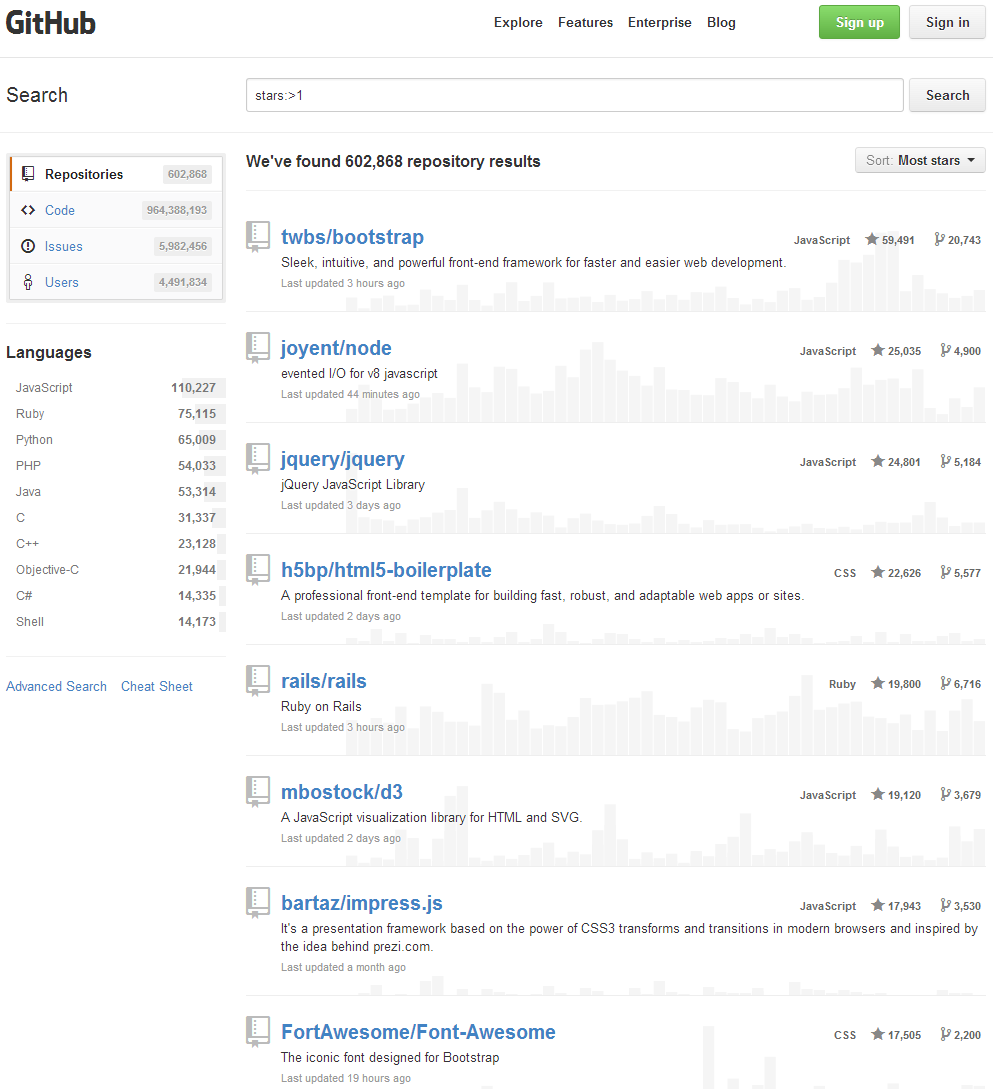
 APIs
APIs - Importance of visualizing this data
- Data-driven journalism
- The Guardian
- The New York Times
- Neue Zürcher Zeitung
Very trendy
But nothing new
Pie charts
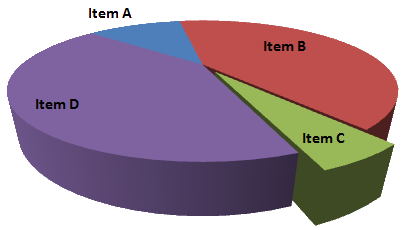
3D pie charts
Data visualization
for the web
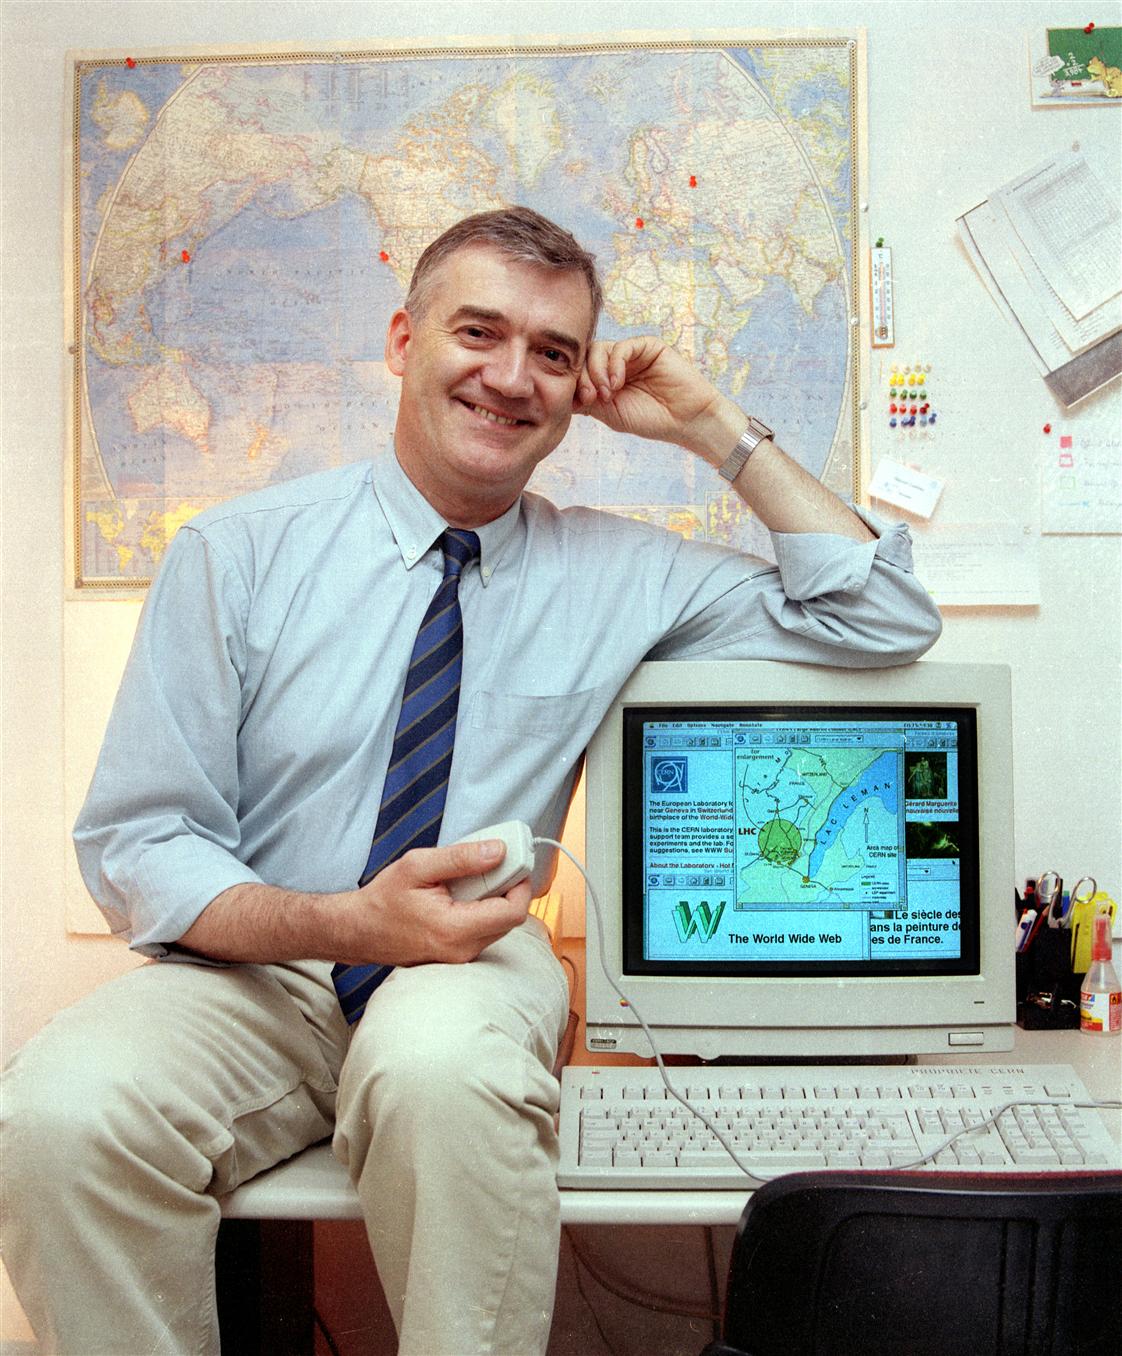
World Wide Web
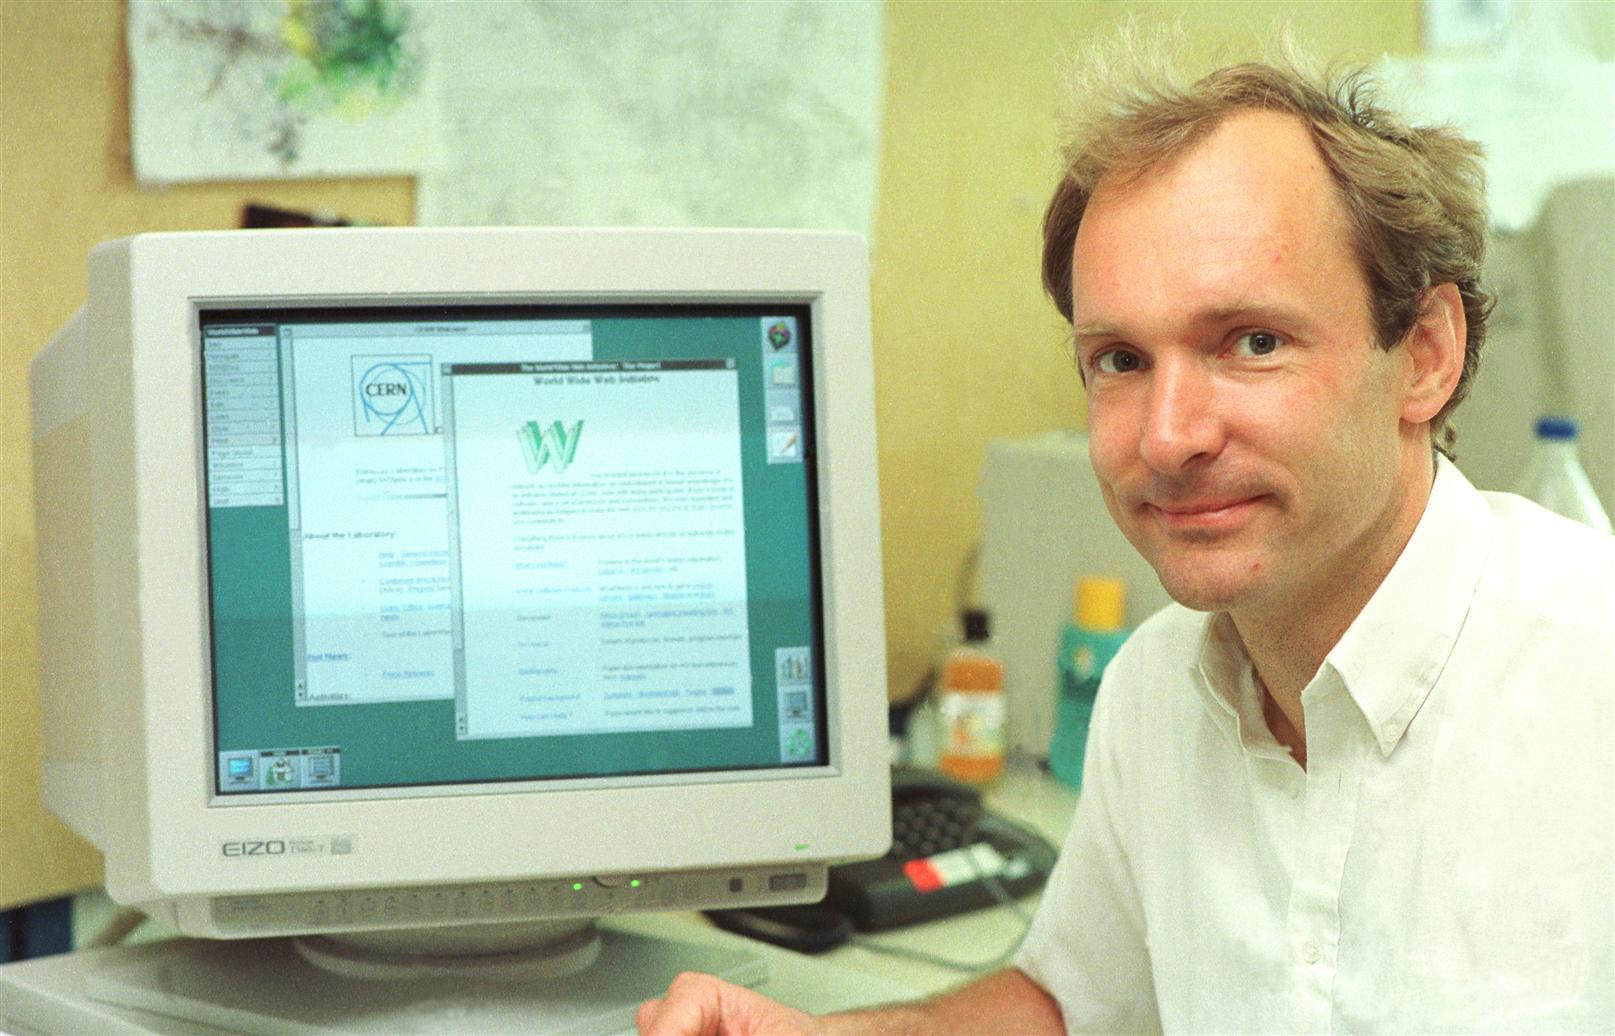
- HTTP
- URL
- HTML
Navigate from one page to the other via hyperlinks
click here
Vectorial vs. Bitmap
Retained mode vs. Immediate mode
| Retained mode (SVG) | Immediate mode (Canvas) |
|---|---|
| Complete model of the graphical objects | Draw and forget |
| Rendering managed by the engine | Full control over rendering |
| Handlers can be attached to graphical elements | Interactions from mouse coordinates |
| Good performance with a reasonable number of objects | “Constant” performance |
Data visualization
for the web with D3.js
14 October 2013
Mike Bostock


An example
Sample data
| name | age | height | weight |
|---|---|---|---|
| Alice | 4 | 100 | 17 |
| Bruno | 2 | 88 | 12 |
| Charles | 85 | 177 | 57 |
| Dédé | 25 | 168 | 67 |
| Etienne | 42 | 182 | 80 |
| Françoise | 8 | 127 | 25 |
| Gégé | 50 | 160 | 83 |
Sample visualization
- person → circle
- age → x-axis
- height → y-axis
- weight → diameter

SVG source
<svg width="640" height="480">
  <circle cx="24"  cy="280" r="17" opacity=".5"/>
  <circle cx="12"  cy="304" r="12" opacity=".5"/>
  <circle cx="510" cy="126" r="57" opacity=".5"/>
  <circle cx="150" cy="144" r="67" opacity=".5"/>
  <circle cx="252" cy="116" r="80" opacity=".5"/>
  <circle cx="48"  cy="226" r="25" opacity=".5"/>
  <circle cx="300" cy="160" r="83" opacity=".5"/>
</svg>
Inverted y-axis (origin at top left)
Sample HTML
<!DOCTYPE html>
<html lang="en">
<head>
  <meta charset="utf-8">
  <title></title>
</head>
<body>

  <div id="placeholder"></div>

  <script src="d3.js"></script>
  <script src="main.js"></script>

</body>
</html>
Package Managers
Available at


- CDN
Sample JavaScript
// main.js


// TODO
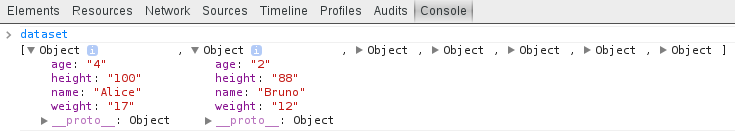
Sample data in JSON
[
  {"name": "Alice",     "age":  4, "height": 100, "weight": 17},
  {"name": "Bruno",     "age":  2, "height":  88, "weight": 12},
  {"name": "Charles",   "age": 85, "height": 177, "weight": 57},
  {"name": "Dédé",      "age": 25, "height": 168, "weight": 67},
  {"name": "Etienne",   "age": 42, "height": 182, "weight": 80},
  {"name": "Françoise", "age":  8, "height": 127, "weight": 25},
  {"name": "Gégé",      "age": 50, "height": 160, "weight": 83}
]
Native format
Sample data in CSV
name,age,height,weight
Alice,4,100,17
Bruno,2,88,12
Charles,85,177,57
Dédé,25,168,67
Etienne,42,182,80
Françoise,8,127,25
Gégé,50,160,83
More compact than JSON
Data retrieval
d3.json('path/to/file.json', function(error, dataset) {
  if (error) return console.warn(error);
  // TODO: Visualize the dataset
});

d3.csv('path/to/file.csv', function(error, dataset) {
  if (error) return console.warn(error);
  // TODO: Visualize the dataset
});

var visualize = function(error, dataset) {
  if (error) return console.warn(error);
  // TODO: Visualize the dataset
};

d3.csv('path/to/file.csv', visualize);
Data retrieval
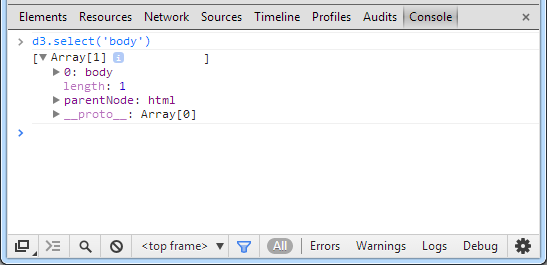
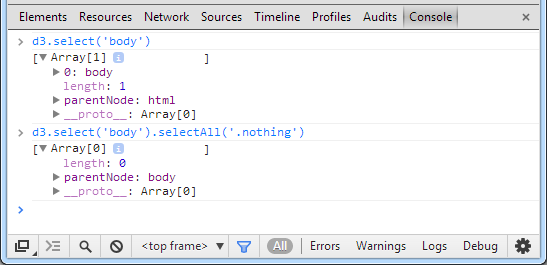
Selection
d3.select('body');
d3.select('.class');
d3.select('#id');
d3.select('[color=black]');
d3.select('parent child');
d3.select('.this.that');
d3.select('.this, .that');

var placeholder = d3.select('#placeholder');
Include Sizzle if needed
Selection
d3.selectAll('body');
d3.selectAll('.class');
d3.selectAll('#id'); // FIXME: Non-unique IDs?
d3.selectAll('[color=black]');
d3.selectAll('parent child');
d3.selectAll('.this.that');
d3.selectAll('.this, .that');

var placeholders = d3.selectAll('.placeholder');
Include Sizzle if needed
Operations on selections
var imgs = d3.selectAll('img')
             .attr('title', 'Tooltips for everyone!');

var h2s = d3.selectAll('h2')
            .style('font-style', 'italic')
            .style('font-weight', 'bold');

var ps = d3.selectAll('p')
           .text('pwned');

var pz = d3.selectAll('p')
           .html('<blink>pwned</blink>');

var svg = d3.select('#placeholder')
            .append('svg')
              .attr('width',  640)
              .attr('height', 480);
Fluent interface (method chaining)
Strings = no limitations linked to the library
append and insert return a new selection
Back to our example
var svg = d3.select('#placeholder')
            .append('svg')
              .attr('width',  640)
              .attr('height', 480);

var visualize = function(error, dataset) {
  if (error) return console.warn(error);
  // TODO: Visualize the dataset
};

d3.csv('path/to/file.csv', visualize);
Visualization
var visualize = function(error, dataset) {
  if (error) return console.warn(error);

  for (var i = 0; i < dataset.length; i++) {
    var person = dataset[i];
    svg.append('circle')
      .attr('opacity', 0.5)
      .attr('r', person.weight)
      .attr('cx', person.age * 6) // 100 years old * 6 ~= 640
      .attr('cy', 480 - person.height * 2); // 200 cm high * 2 ~= 480
  }
};
Result
The End?
Sample data... and more
| name | age | height | weight |
|---|---|---|---|
| Alice | 4 | 100 | 17 |
| Bruno | 2 | 88 | 12 |
| Charles | 85 | 177 | 57 |
| Dédé | 25 | 168 | 67 |
| Etienne | 42 | 182 | 80 |
| Françoise | 8 | 127 | 25 |
| Gégé | 50 | 160 | 83 |
| name | age | height | weight |
|---|---|---|---|
| Alice | 9 | 140 | 30 |
| Bruno | 7 | 110 | 22 |
| Dédé | 30 | 172 | 75 |
| Etienne | 47 | 182 | 70 |
| Zoé | 2 | 84 | 10 |
| Françoise | 13 | 141 | 42 |
Visualization v1.1
var visualize = function(error, dataset) {
  if (error) return console.warn(error);

  svg.selectAll('circle').remove();

  for (var i = 0; i < dataset.length; i++) {
    var person = dataset[i];
    svg.append('circle')
    // ...
  }
};

d3.csv('path/to/dataset-2000.csv', visualize);

// Called later...
d3.csv('path/to/dataset-2005.csv', visualize);
Selection of a selection d3.select('svg').selectAll('circle')
Result v1.1
No animation... no fun!
Throw it out and go back to the drawing board?
TODO v2.0
- Keep the circles
- Transitions (interpolate positions and diameters)
- Appearances and disappearances
Binding
aka Join
Thinking with Joins

Visualization v2.0
var visualize = function(error, dataset) {
  if (error) return console.warn(error);

  var circles = svg
    .selectAll('circle')
    // The unique key is the name.
    .data(dataset, function(d) { return d.name; });

  // UPDATE
  circles
    //...

  // ENTER
  circles
    .enter()
    //...

  // EXIT
  circles
    .exit()
    //...
};
parentNode
Visualization v2.0
// UPDATE
circles
  .transition().duration(750)
  .call(positionAndSizeCircle);

// ENTER
circles
  .enter()
  .append('circle')
  .style('opacity', 0)
  .call(positionAndSizeCircle)
  .transition().duration(750)
  .style('opacity', 0.5);

// EXIT
circles
  .exit()
  .transition().duration(750)
  .style('opacity', 0)
  .remove();
Visualization v2.0
var positionAndSizeCircle = function(circle) {
  circle
    .attr('r', function(d) {
      return d.weight;
    })
    .attr('cx', function(d) {
      return d.age * 6; // 100 years old * 6 ~= 640
    })
    .attr('cy', function(d) {
      return 480 - d.height * 2; // 200 cm high * 2 ~= 480
    });
};
Sticky data: __data__
Result v2.0
What’s left
- Scales (domain, range)
- Axes
- Interactions
- ...
Advanced examples
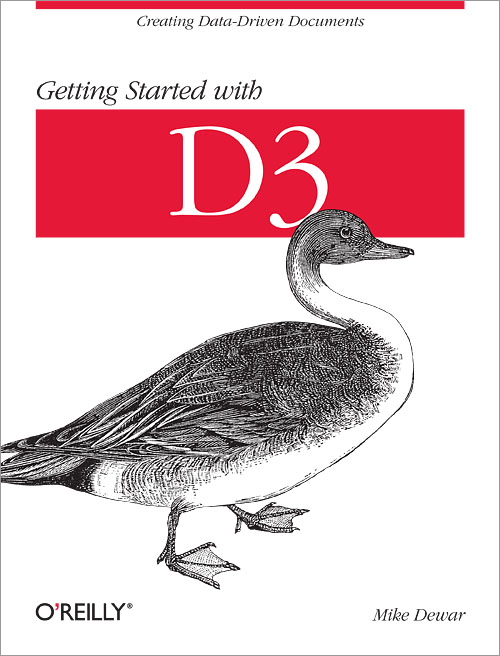
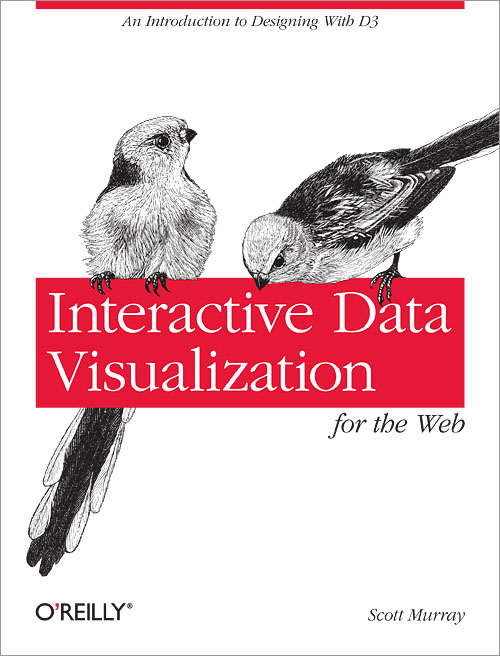
Books
Conclusion
- Technology choice
- Take time to think about it
- Trial and error
- Meticulousness
Credits
This presentation has been created with
some code
some fonts
some pixels
Image credits
 by Nataraja (CC BY-SA 3.0)
- by Flo (CC BY-SA-2.5)
- by Darkzink (CC0 1.0)
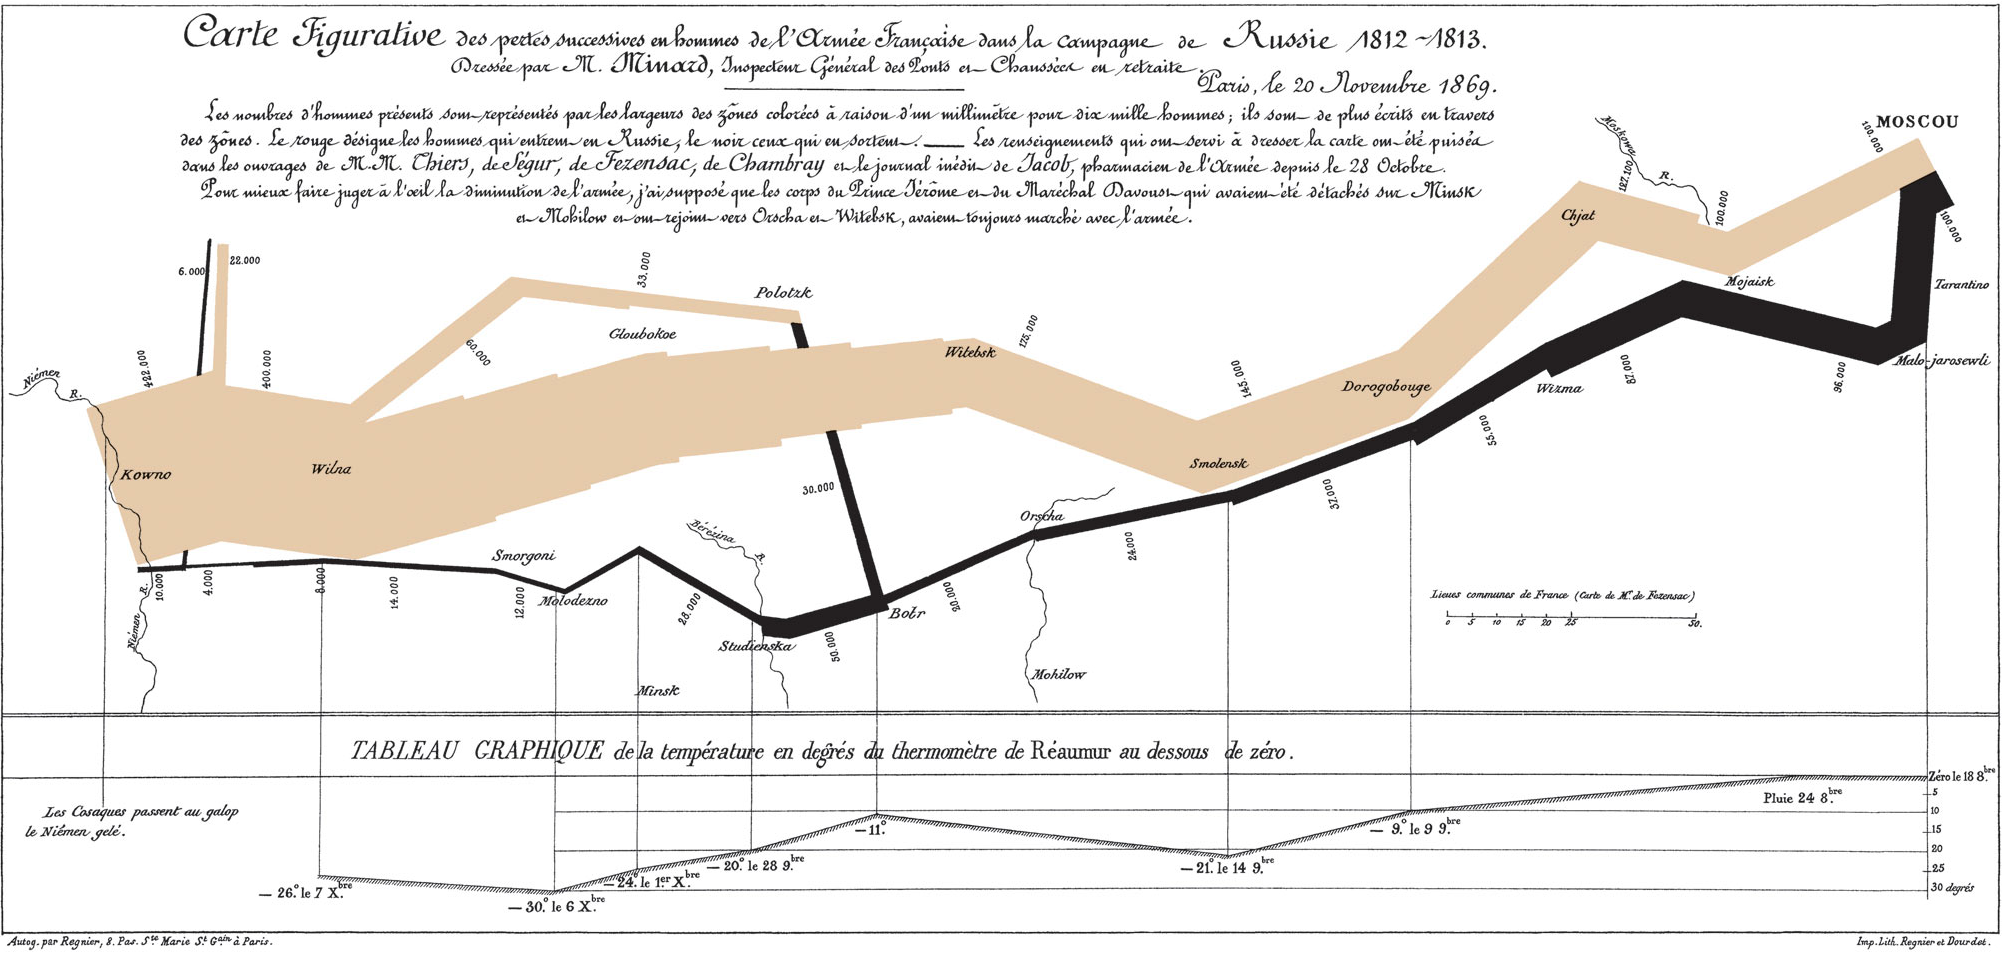 © 1869 Charles Joseph Minard
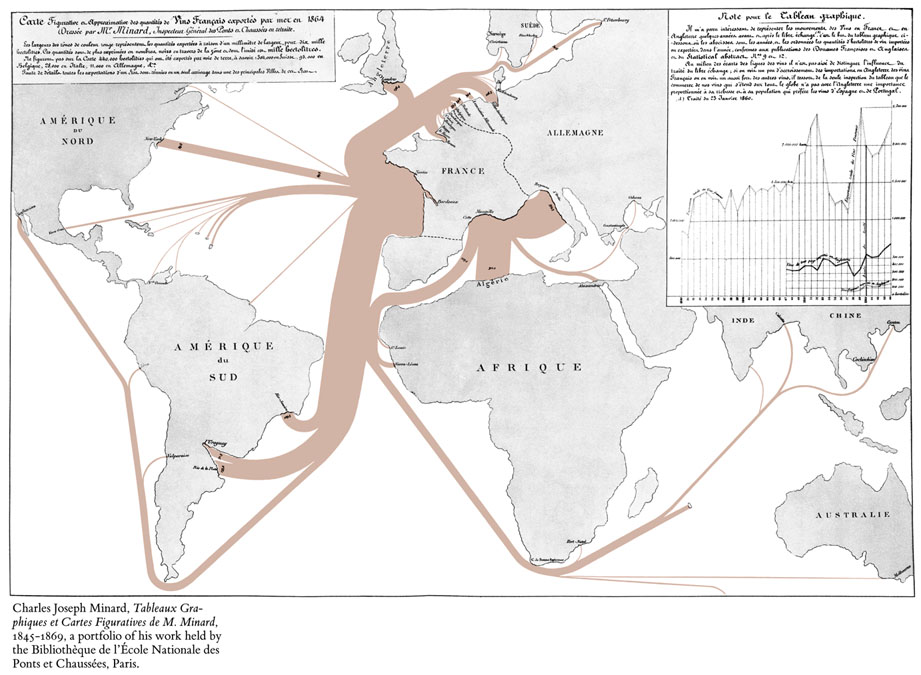 © 1865 Charles Joseph Minard
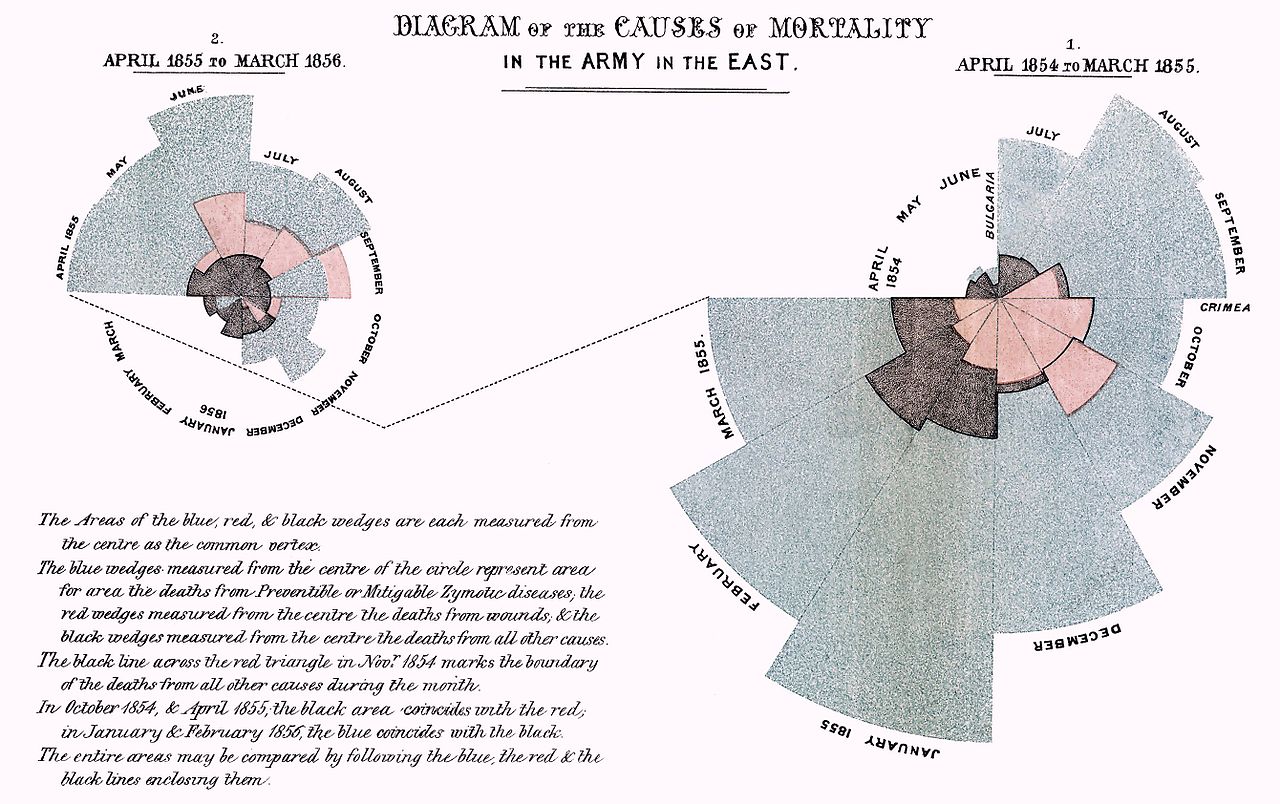 © 1858 Florence Nightingale
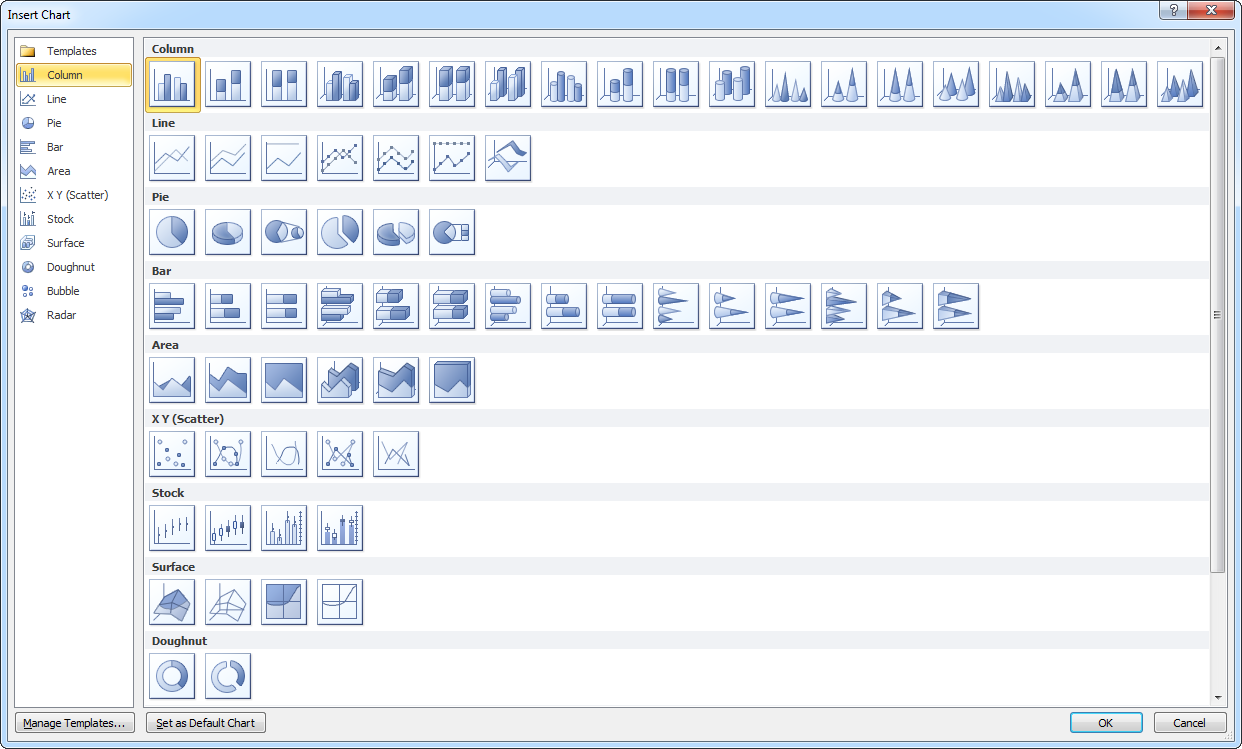 Used with permission from Microsoft
 by STML (CC BY-NC-ND 2.0)
.jpg)


- by Smallman12q (CC0 1.0)
- by Smallman12q (CC0 1.0)
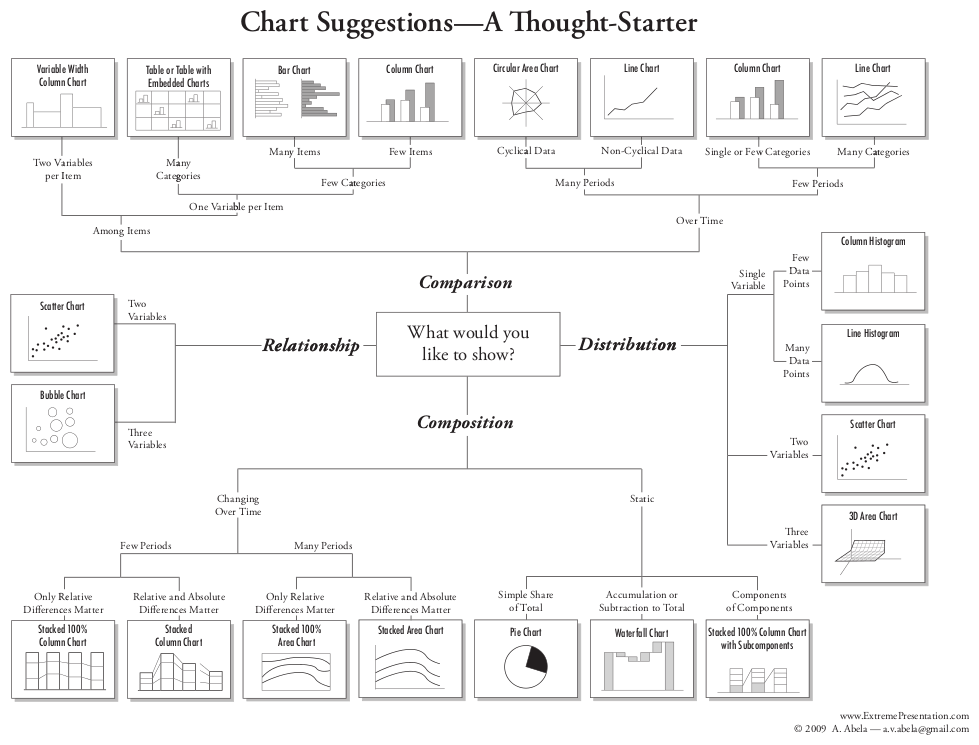 © 2009 Andrew Abela
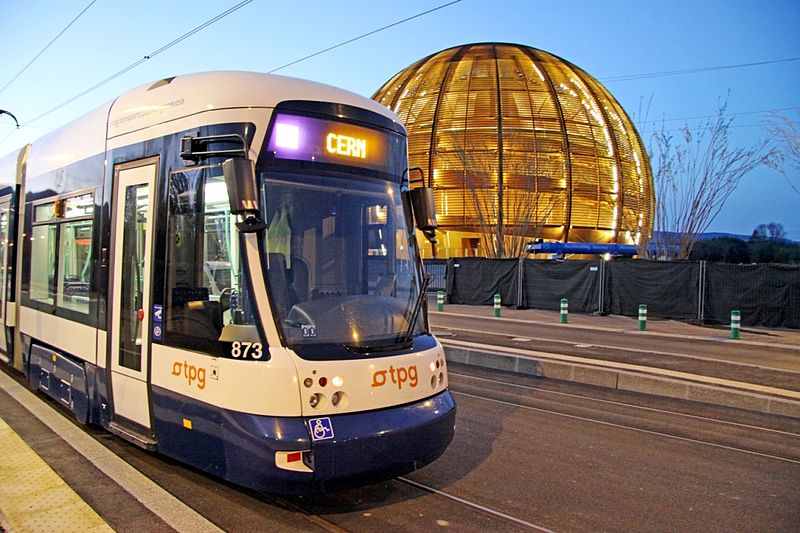
- © 1994 CERN
- © 1995 CERN
- © 2012 Mike Bostock

